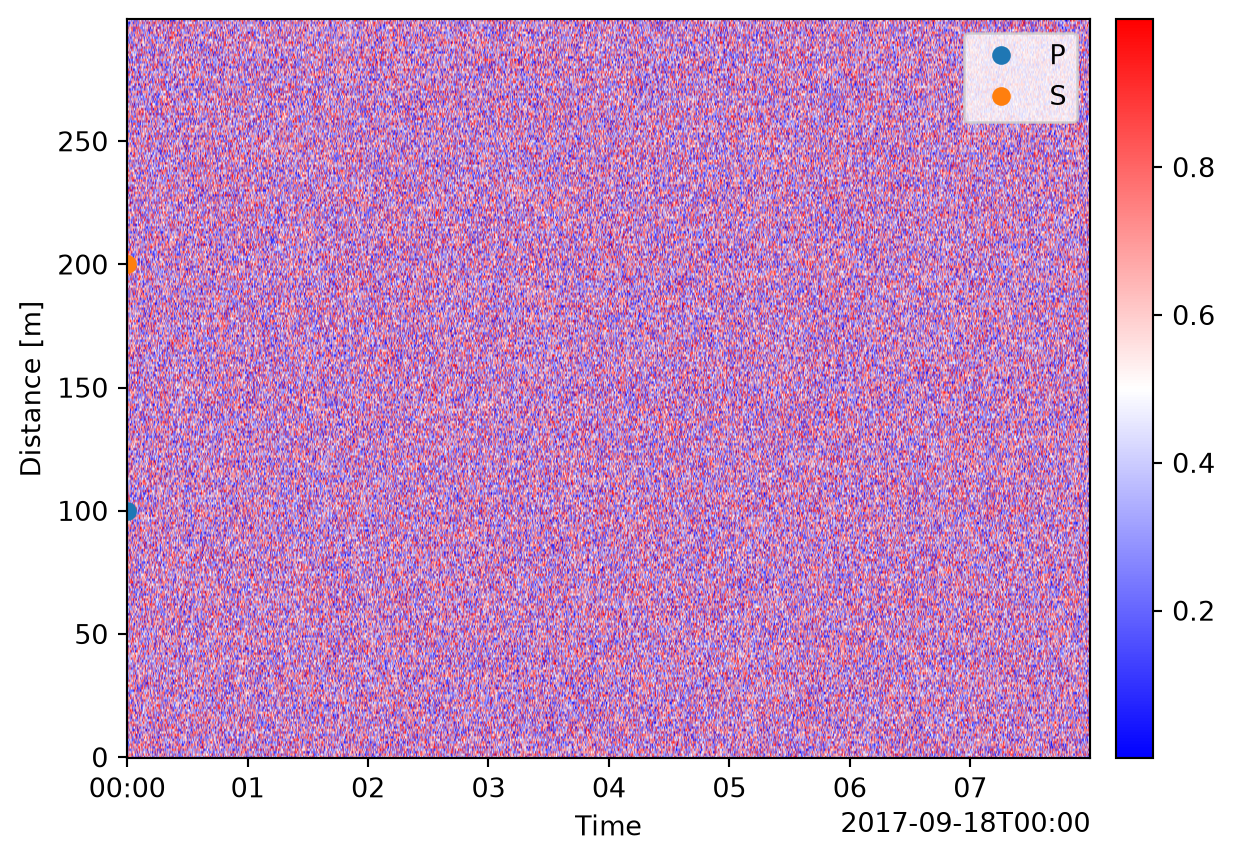
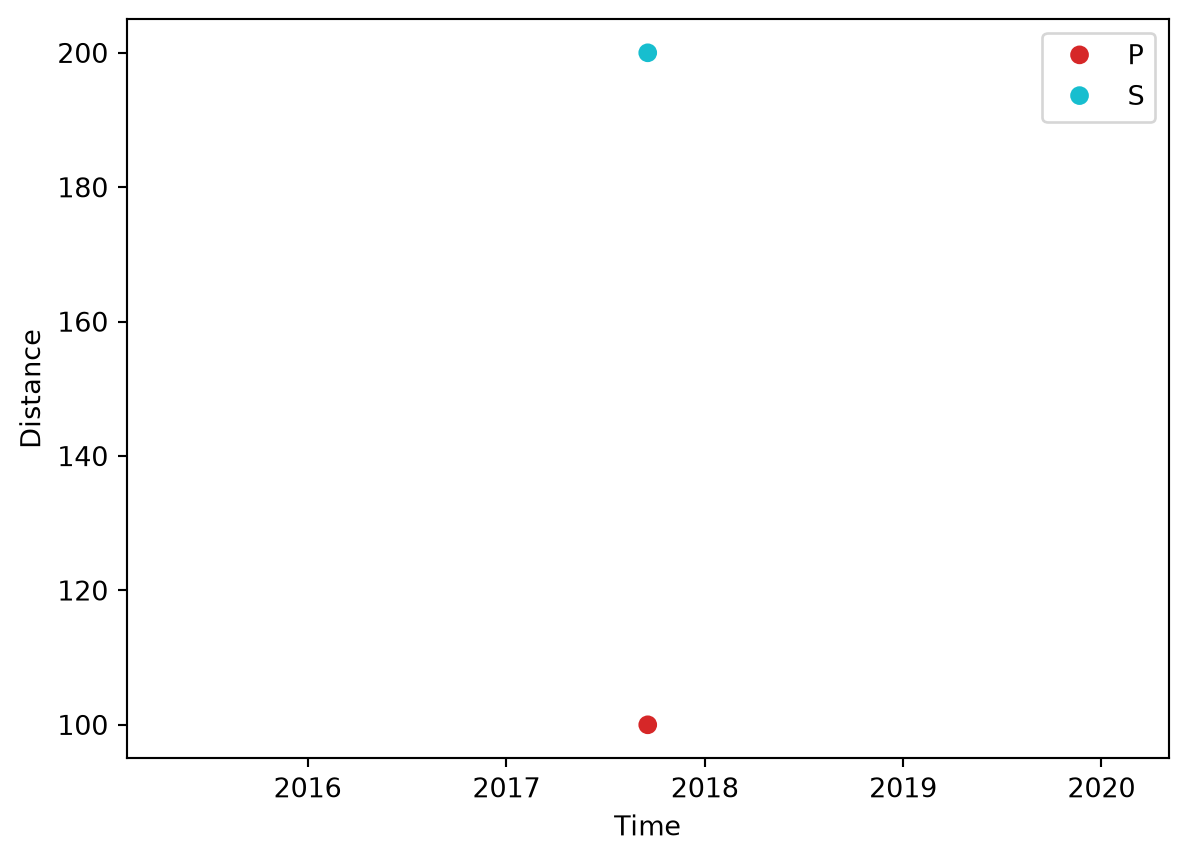
Draw every feature of the set on an axis, e.g. over a waterfall.
Parameters
Parameter
Description
annotations
The set to draw.
ax
The axis to draw on; one is made if None.
x, y
Dimensions for the axes; default dims[-1] and dims[0], as waterfall puts them. A one-dimensional set draws along x, or along y when only y is named. A set of more dimensions names both.
color
A matplotlib color, or a column of either table whose values are colored from palette first, then the property cycle, with a legend. A row blank on both tables is black; a feature blank on both reads its first member. By default everything is black.
label
A column whose values label the artists in a legend; a blank value is left out of it. Without it or a color column, a legend names the kinds drawn (picks, regions, paths, polygons) when there are two or more.
palette
Colors for values of the color column, e.g. {"P": "tab:red"}; values not in it take cycle colors it does not already use.
**style
Passed to every artist, e.g. alpha or linewidth, overriding the defaults; marker keys and path_effects reach only lines and markers.
Note
A row is a marker where it states a value on both axes, a line or span where it states one axis, a segment where it states a value and a range, and a box for two ranges; a row stating neither axis is not drawn. A group draws its members, a path a line per part, and a polygon a filled patch per part with its holes left empty. A path or polygon not drawn in both axes is skipped. Lines and markers have a white halo, and filled artists a solid edge, to stand out over a waterfall.