import dascore as dc
from dascore.viz.inventory import path

inventory = dc.get_example_inventory("tunnel")
_ = path(inventory, time="2024-07-01", distance=(1495, 1780))
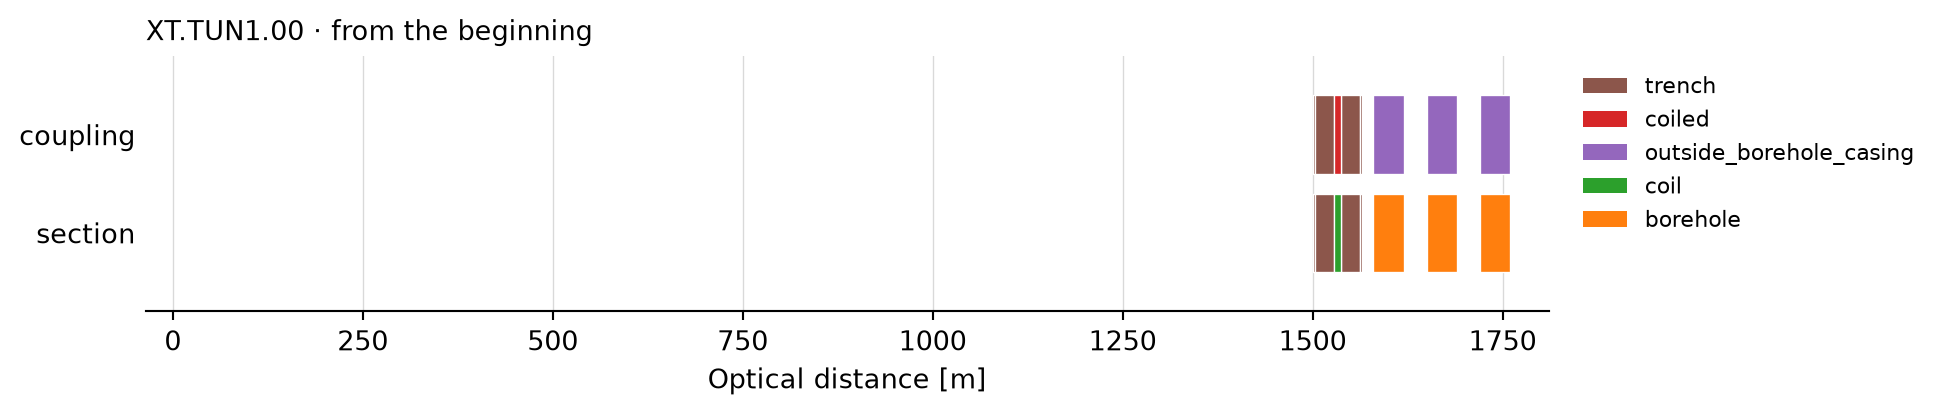
_ = path(inventory, time="2024-07-01", tracks=("coupling", "section"))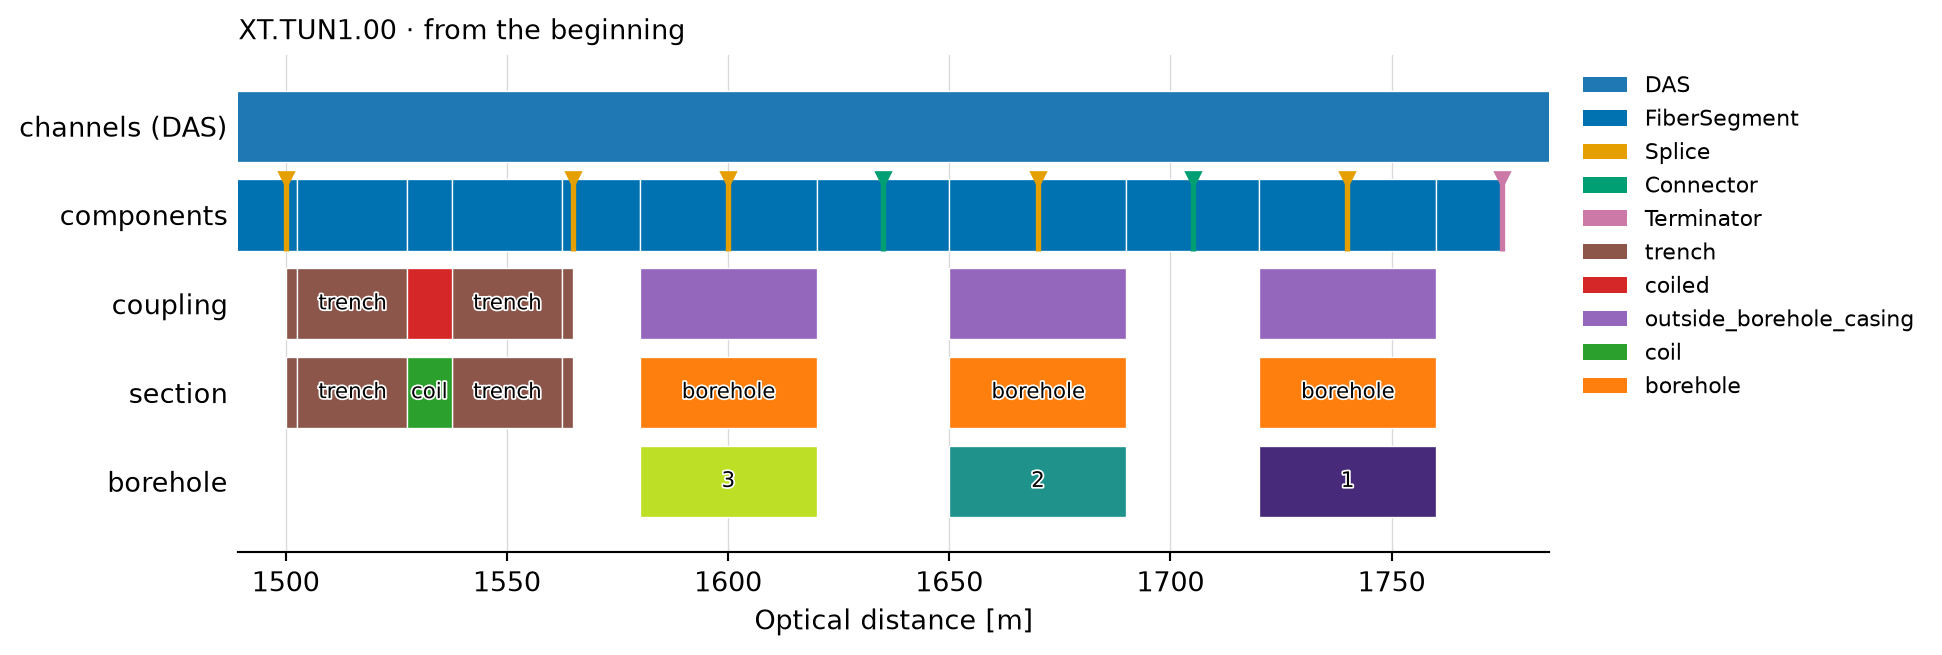
path(
inventory: ‘Inventory’ ,
optical_path: ‘str | OpticalPath | None’ = None,
acquisition_key: ‘str | None’ = None,
time: ‘timeable_types | None’ = None,
distance: ‘tuple | None’ = None,
tracks: ‘str | Sequence[str] | None’ = None,
columns: ‘str | Sequence[str] | None’ = None,
n_samples: ‘int’ = 1000,
color: ‘str | Mapping | None’ = None,
max_labels: ‘int’ = 200,
ax: ‘plt.Axes | None’ = None,
show: ‘bool’ = False,
)-> ‘plt.Axes’
Plot what lies along one optical path, against optical distance.
Every track becomes a lane: one per acquisition recording through the path, spanning the distances its channels cover, the optical components which give the path its length, how it is coupled to the ground, and one lane per label group. A geometry column such as chainage or depth can be drawn as a line panel beneath, sharing the distance axis; it breaks wherever the path states no value rather than bridging the gap. Where the fiber physically is belongs to map().
| Parameter | Description |
|---|---|
| inventory | The inventory holding the path. |
| optical_path |
The path to draw, as an network.array.location address, apath name, or the object. Optional when the choice is not ambiguous. |
| acquisition_key | Resolve the path from an acquisition key instead. |
| time |
The instant to resolve at, which is how one epoch of a repaired path is chosen. |
| distance |
The optical distances to draw between, as (min, max). Either end may be None, or …, to run to the path’s own bound. A long lead-in otherwise crushes the instrumented part into a corner. |
| tracks |
Which lanes to draw, in order: any of “acquisition”, “components”, “coupling”, and the path’s label group names. None draws all. “acquisition” draws one lane per acquisition, named with its code. A label group may take a track’s name, since what an inventory reserves are the coordinate names; both lanes are then drawn, and neither can be asked for on its own. |
| columns |
Geometry columns to draw as line panels beneath the lanes. The CRS’s position axes are refused, since they belong on a map. |
| n_samples | How finely the columns are sampled. |
| color | Passed to the lane renderer to override its colors. |
| max_labels |
Draw no lane text at all past this many intervals. Below that count, a label too wide for its box is turned on its side, and dropped only if it does not fit that way either. |
| ax |
An Axes to draw the lanes on; one is created, a lane tall per track, when None. Pass one to say how large the plot is. Column panels need their own figure, so passing this and naming columns is refused; size that figure with path(...).get_figure().set_size_inches(width, height), whichlays it out again at the size asked for. |
| show | Whether to call plt.show. |
import dascore as dc
from dascore.viz.inventory import path
inventory = dc.get_example_inventory("tunnel")
_ = path(inventory, time="2024-07-01", distance=(1495, 1780))
_ = path(inventory, time="2024-07-01", tracks=("coupling", "section"))