import dascore as dc
from dascore.viz.spool import calendar
spool = dc.get_example_spool("sparse_dss")
_ = calendar(spool)
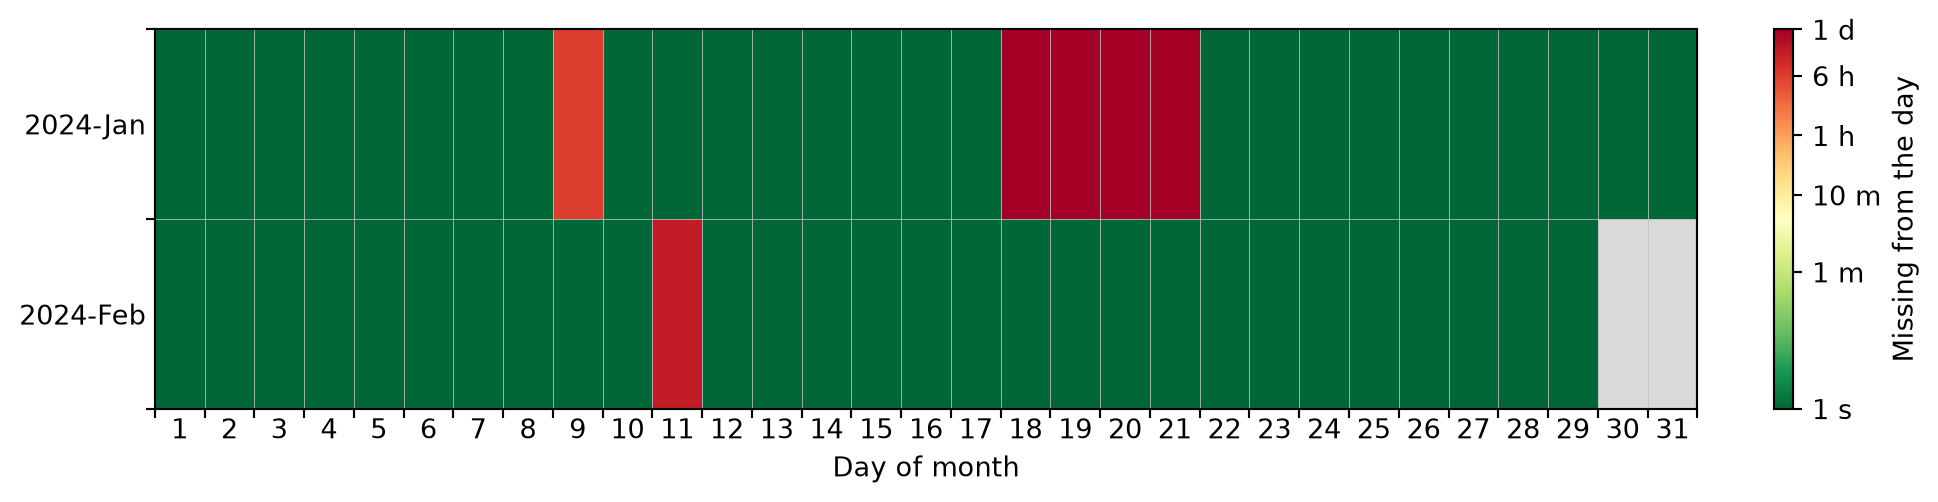
_ = calendar(spool, method="gap")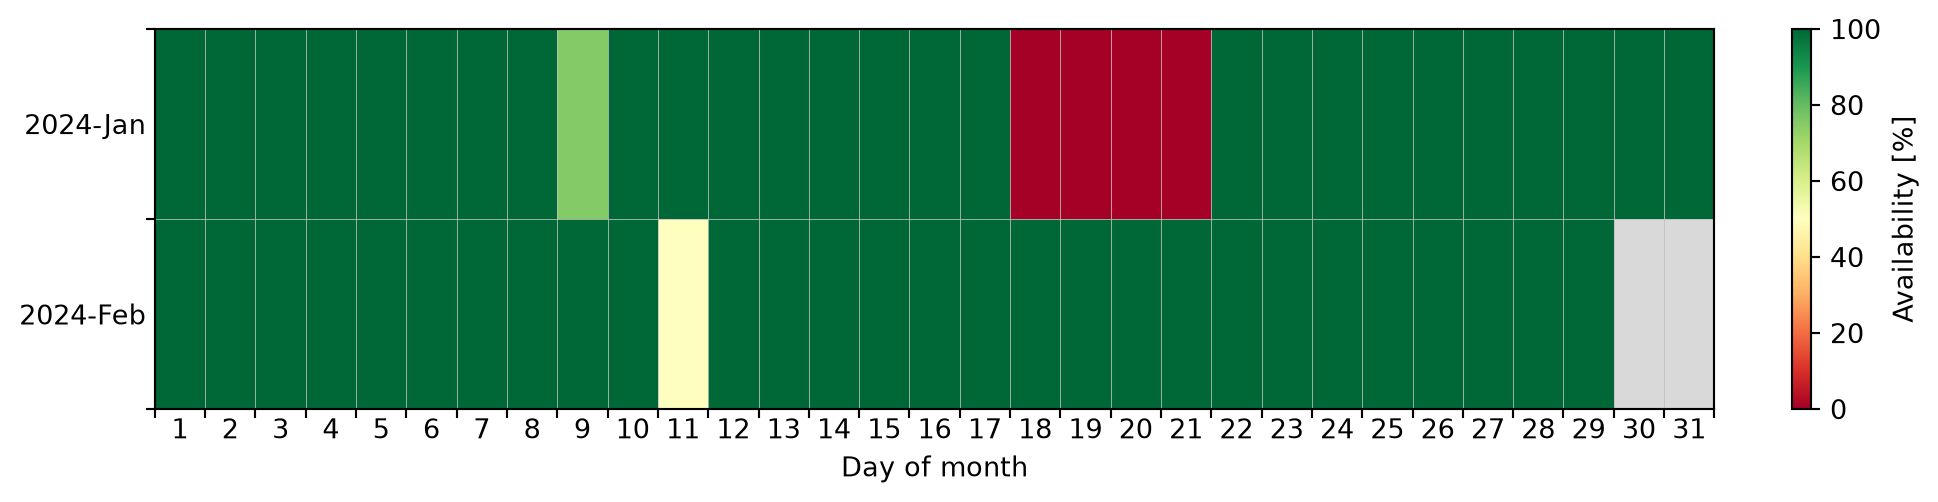
calendar(
spool ,
method: str = percent,
tolerance: float | pint.registry.Quantity | numpy.timedelta64[float, Quantity, timedelta64] = 1.5,
group: str | collections.abc.Sequence[str, collections.abc.Sequence[str], None] = None,
ax: matplotlib.axes._axes.Axes | None[Axes, None] = None,
show: bool = False,
)-> ‘plt.Axes’
Plot how much data a spool holds on each day, as a calendar.
One row per month and one column per day of month, colored by what method asks for. The runs a day is measured against are the ones get_gaps leaves between its gaps, so a day drawn as full is a day chunk would merge end to end.
  </tr>
  <tr>
      <td>tolerance</td>
      <td>How many samples patches may be spaced and still count as<br>contiguous, or a quantity or timedelta stating that limit in the<br>coordinate's own units (eg `1 * s`). Same meaning as chunk's<br>`tolerance`.</td>
  </tr>
  <tr>
      <td>group</td>
      <td>Attributes which separate patches into unrelated groups. Defaults<br>to the config option `patch_kind_attrs`. It decides which<br>boundaries are gaps; a day is the union of every group's data,<br>so regrouping moves a day's total only where it moves a gap.</td>
  </tr>
  <tr>
      <td>ax</td>
      <td>A matplotlib Axes; one is created, a row tall per month, when<br>None. Pass one to say how large the plot is.</td>
  </tr>
  <tr>
      <td>show</td>
      <td>Whether to call plt.show.</td>
</tr>| Parameter | Description |
|---|---|
| spool | The spool to measure. |
| method | What each day says. |
|
Groups which run at once cover one day between them, not two, so a day is the measure of what they cover together and never exceeds 100%. A day the spool says nothing about is drawn grey; one it covers by nothing at all is drawn as empty, which is a different claim.
group is not a way to pick one of them: select the patches first, as spool.select(tag="temperature").viz.calendar(), and the calendar is of those alone. Days are chosen the same way — the calendar runs from the first day the spool holds to the last, so spool.select(time=(start, end)).viz.calendar() draws that season and measures it. It draws the days that selection kept: an outage at either end of the window falls outside the calendar rather than filling it, and a window with no data in it at all is a spool of nothing, which has no calendar. Draw the wider spool to see an outage measured.
A run covers one sample past the last one it states, taken from the step its group reports. Patches within sampling_group_tolerance of each other share a group and so share that step, which rounds a day’s total by at most one sample.
import dascore as dc
from dascore.viz.spool import calendar

spool = dc.get_example_spool("sparse_dss")
_ = calendar(spool)
_ = calendar(spool, method="gap")