import dascore as dc
from dascore.viz.spool import coverage

spool = dc.get_example_spool("diverse_das")
_ = coverage(spool)
_ = coverage(spool, "distance")
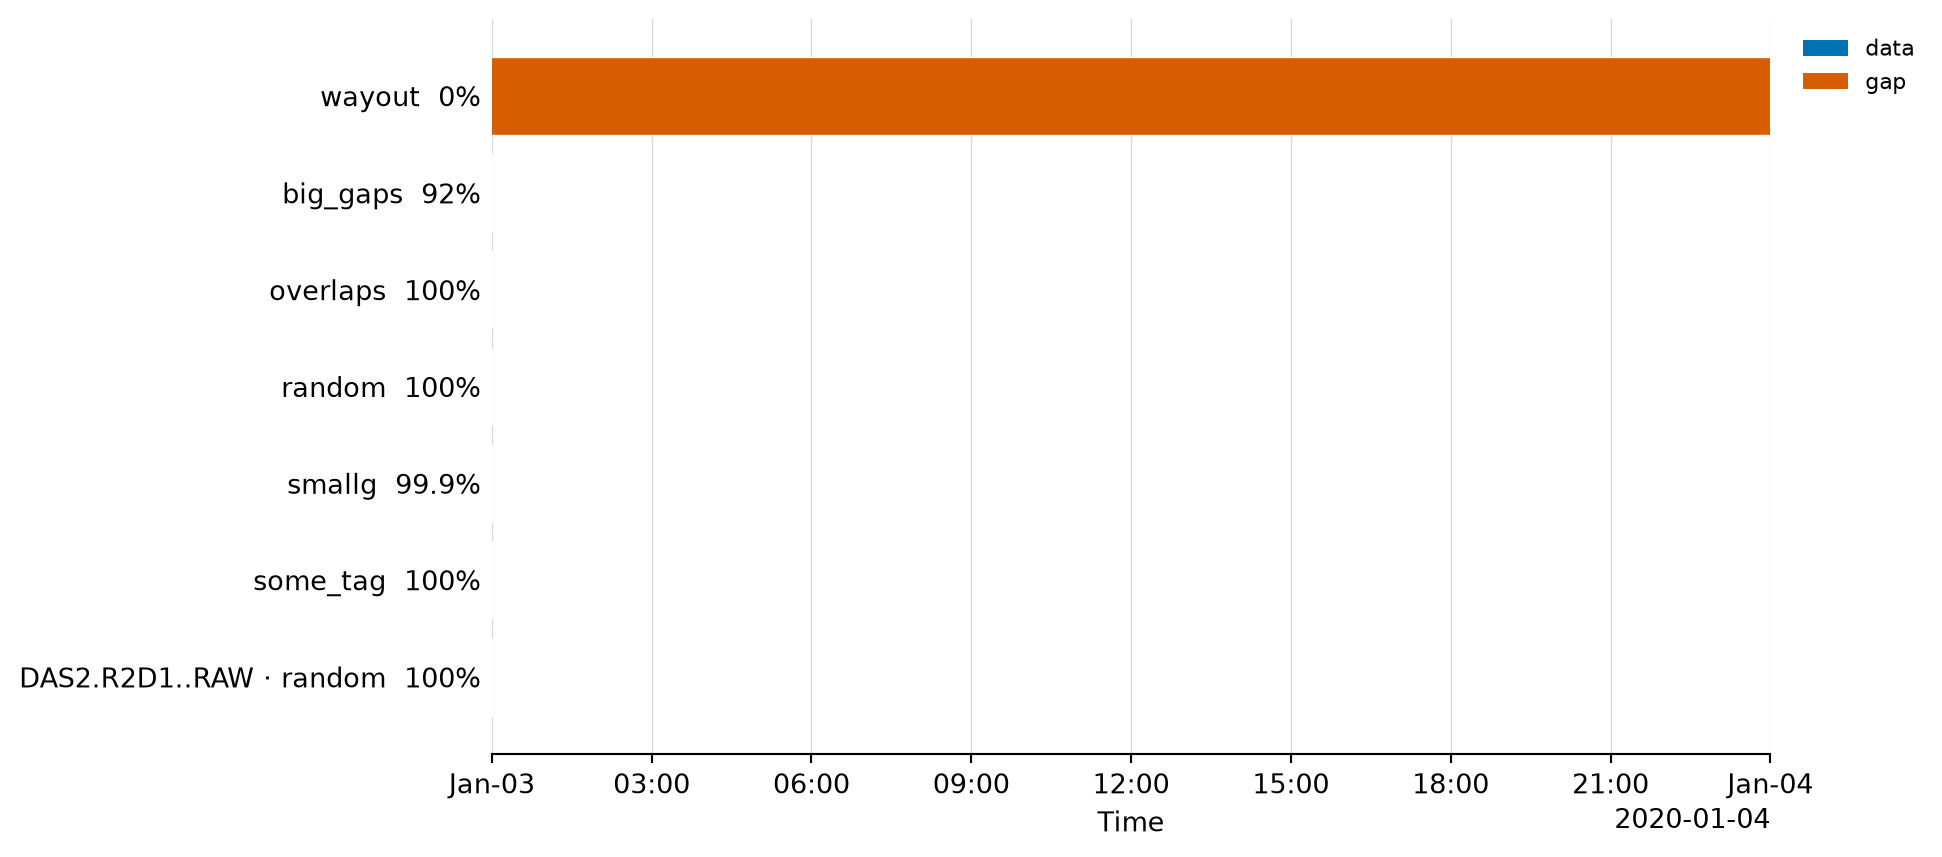
_ = coverage(spool.select(time=("2020-01-03", "2020-01-04")))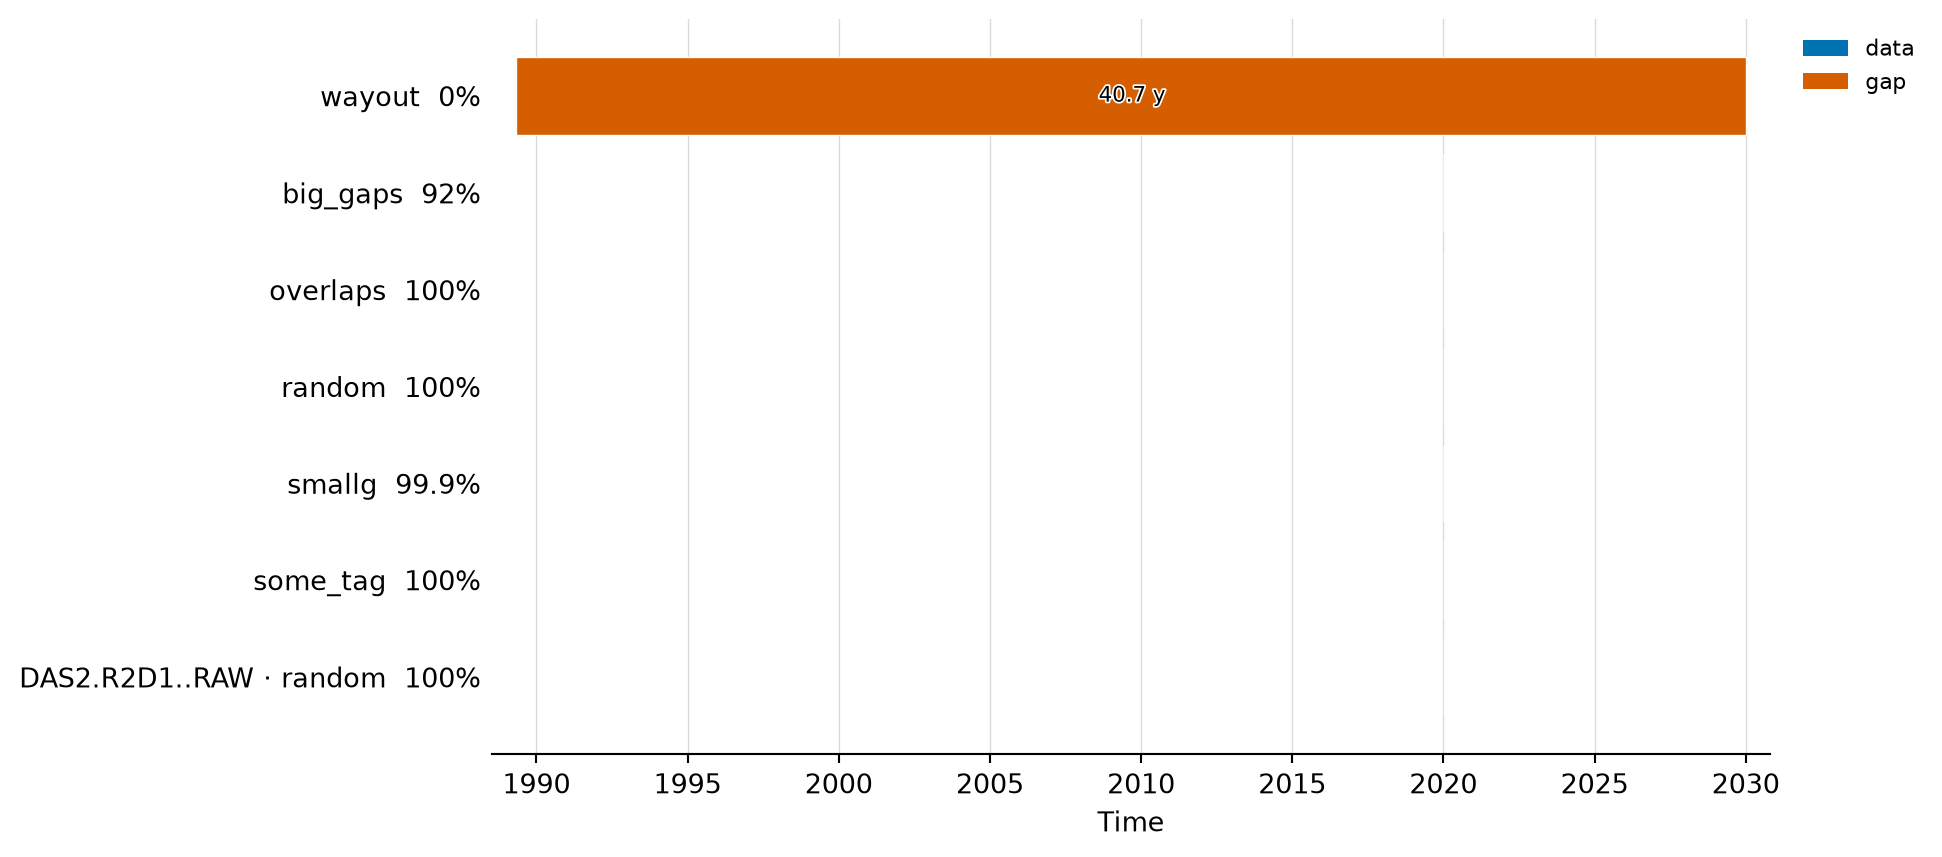

coverage(
spool ,
dim: str = time,
tolerance: float | pint.registry.Quantity | numpy.timedelta64[float, Quantity, timedelta64] = 1.5,
group: str | collections.abc.Sequence[str, collections.abc.Sequence[str], None] = None,
color = None,
ax: matplotlib.axes._axes.Axes | None[Axes, None] = None,
show: bool = False,
)-> ‘plt.Axes’
Plot what a spool covers along a dimension, and where it does not.
One lane per group of patches which could combine, drawn as the runs the group holds and the holes between them. The holes are the ones get_gaps reports, so a gap drawn here is exactly a boundary chunk with a fill_value would refuse to close, and the percentage on each lane is that group’s get_coverage.
| Parameter | Description |
|---|---|
| spool | The spool to measure. |
| dim | The dimension to measure along. |
| tolerance |
How many samples patches may be spaced and still count as contiguous, or a quantity or timedelta stating that limit in the coordinate’s own units (eg 1 * s). Same meaning as chunk’stolerance.
|
| group |
Attributes which separate patches into unrelated groups; a gap is never reported between two groups. Defaults to the config option patch_kind_attrs.
|
| color | A mapping of “data” and “gap” to colors, overriding the default. |
| ax |
A matplotlib Axes; one is created, a lane tall per group, when None. Pass one to say how large the plot is. |
| show | Whether to call plt.show. |
The whole of what the spool holds is drawn. A part of it is a smaller spool: select it first, as spool.select(time=(start, end)).viz.coverage(), and the lanes and their percentages are of that window rather than of a window drawn over percentages of everything. To keep the whole picture and look at part of it instead – where a lane running off the edge says the data does not stop there – set the limits on the axes this returns. Labels are laid out for the extent drawn, so a zoom made that way shows fewer of them than it has room for.
Coverage is measured between patches, from the envelopes the index records, so a hole inside a patch is not visible here. A lane reading 100% says “nothing chunk would refuse to merge”, not “nothing missing”.
import dascore as dc
from dascore.viz.spool import coverage
spool = dc.get_example_spool("diverse_das")
_ = coverage(spool)
_ = coverage(spool, "distance")
_ = coverage(spool.select(time=("2020-01-03", "2020-01-04")))