import matplotlib.pyplot as plt
import numpy as np

import dascore as dc
from dascore.utils.time import to_float

rng = np.random.default_rng(42)


def plot_time_and_frequency(patch, channel=0):
    """Plot one channel in the time domain, with its amplitude and phase spectra."""
    sq_patch = patch.select(distance=channel, samples=True).squeeze()
    time_array = to_float(patch.get_array("time"))
    time = time_array - np.min(time_array)

    fig, (td_ax, fd_ax, phase_ax) = plt.subplots(1, 3, figsize=(9, 2.5))

    # Plot in time domain
    td_ax.plot(time, sq_patch.data, color="tab:blue")
    td_ax.set_title("Time Domain")
    td_ax.set_xlabel("time (s)")

    # Plot frequency amplitude
    ft_patch = sq_patch.dft("time", real=True)
    freq = ft_patch.get_array("ft_time")
    fd_ax.plot(freq, ft_patch.abs().data, color="tab:red")
    fd_ax.set_xlabel("Frequency (Hz)")
    fd_ax.set_title("Amplitude Spectra")

    # Plot frequency phase
    phase_ax.plot(freq, np.angle(ft_patch.data), color="tab:cyan")
    phase_ax.set_xlabel("Frequency (Hz)")
    phase_ax.set_title("Phase Angle")
    return fig


def make_noisy_sine_patch():
    """Make a noisy sine wave patch."""
    patch = dc.get_example_patch(
        "sin_wav",
        frequency=[1, 10, 20, 54, 66],
        amplitude=[1, 2, 3, 4, 9],
        duration=1,
        sample_rate=200,
    )
    rand_noise = (rng.random(patch.data.shape) - 0.5) * 10
return patch.new(data=patch.data + rand_noise)Whitening
Patch.whiten performs spectral whitening: it balances the amplitude spectrum of a patch while leaving the phase largely unchanged. Whitening is a common pre-processing step in ambient noise correlation workflows.
Example data
A plotting helper shows one channel’s waveform, amplitude spectrum, and phase. The example patch is a sum of sine waves with seeded random noise.
noisy_patch = make_noisy_sine_patch()
plot_time_and_frequency(noisy_patch);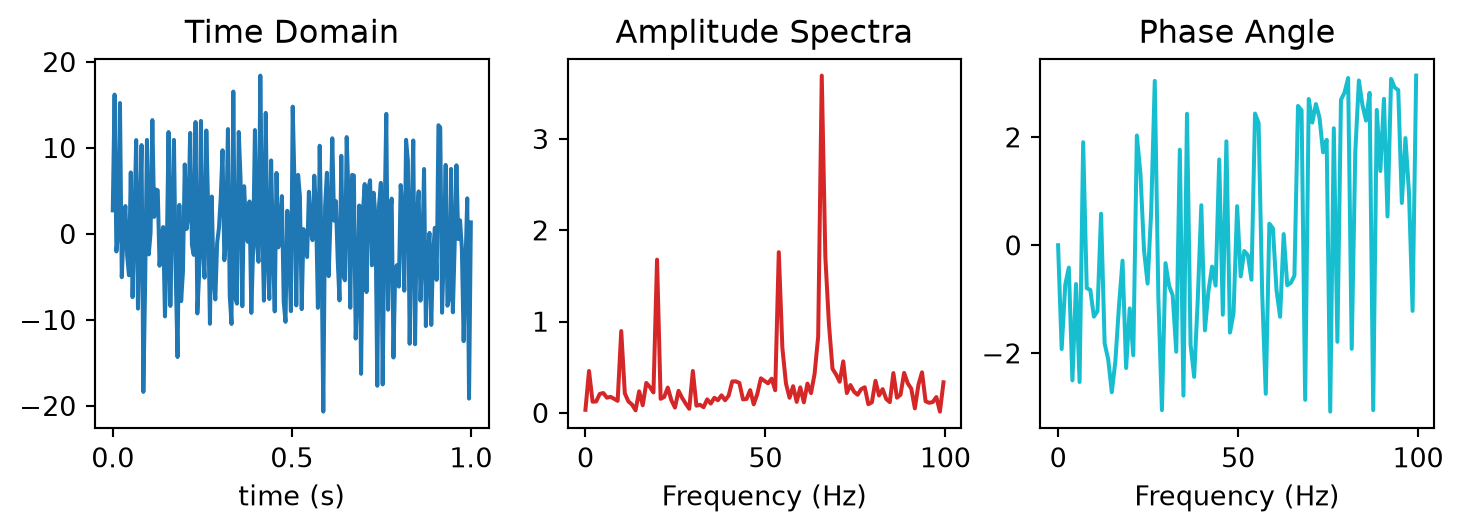
Full band
The default whitening makes all spectral amplitudes equal.
white_patch = noisy_patch.whiten()
plot_time_and_frequency(white_patch);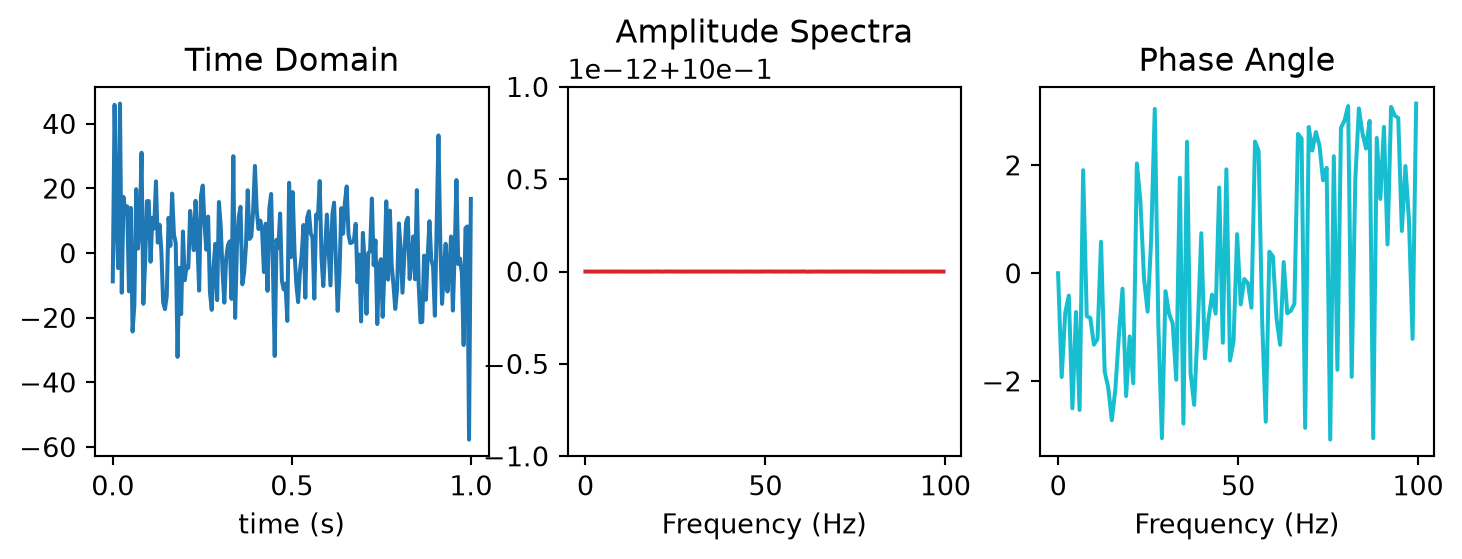
Frequency bands
Name the dimension and a frequency range to whiten only that band.
white_band = noisy_patch.whiten(time=(20, 80))
plot_time_and_frequency(white_band);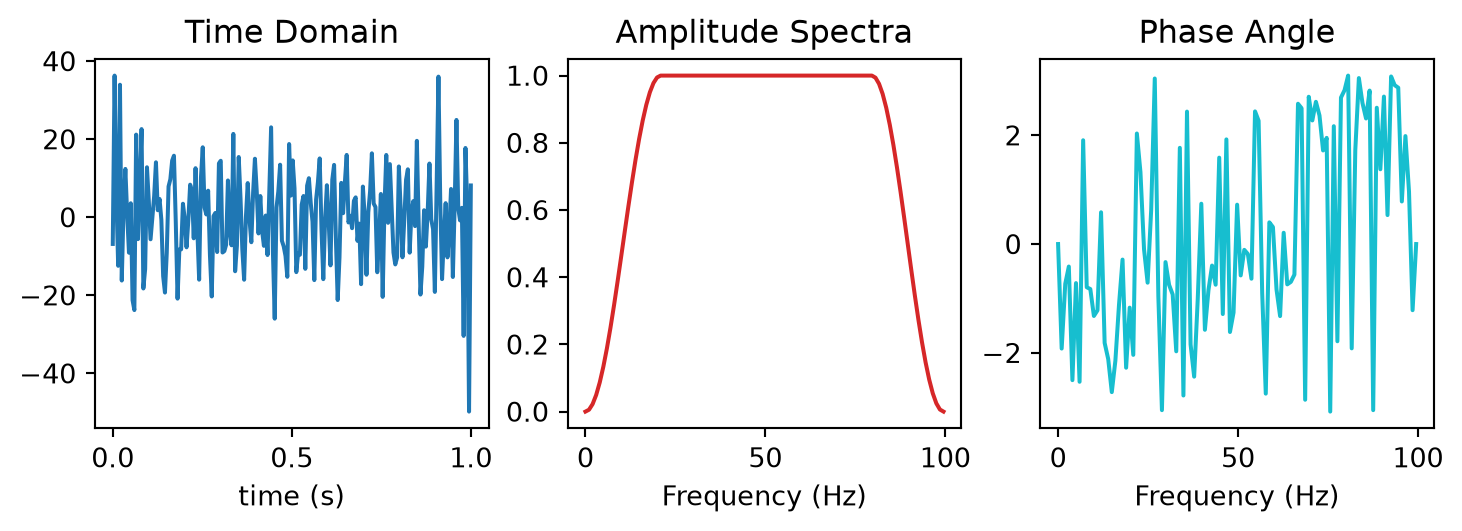
Four values set where the taper starts and ends.
white_tapered = noisy_patch.whiten(time=(20, 40, 60, 80))
plot_time_and_frequency(white_tapered);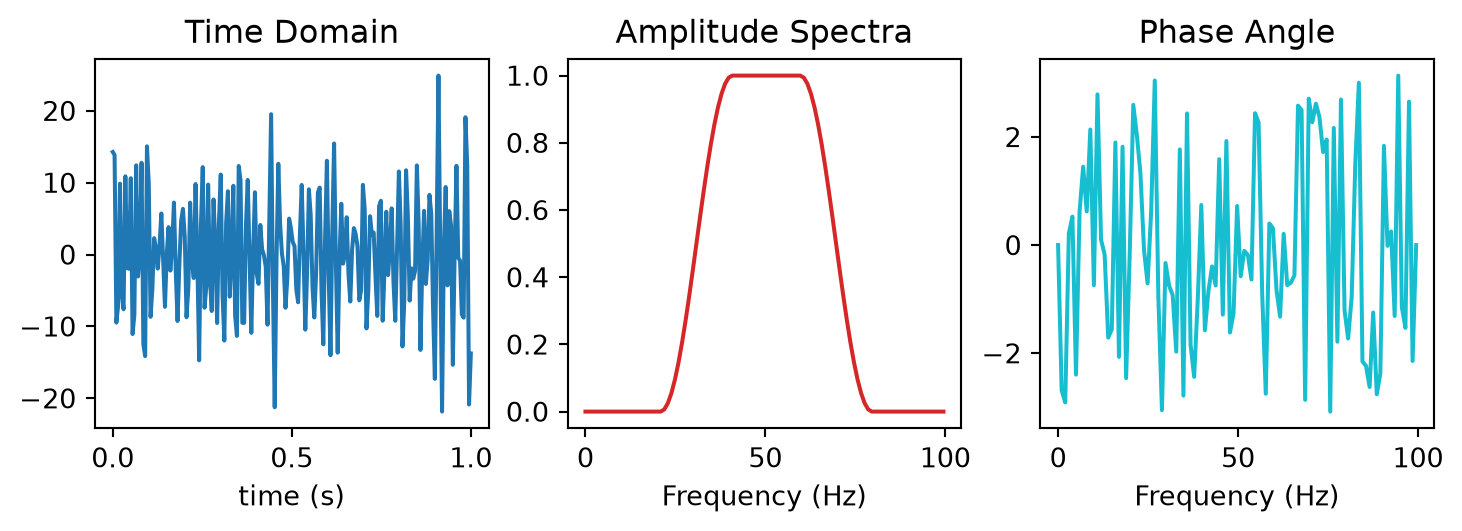
Smoothing
smooth_size normalizes by a smoothed amplitude spectrum, which changes the spectrum less drastically.
white_smooth = noisy_patch.whiten(smooth_size=1)
plot_time_and_frequency(white_smooth);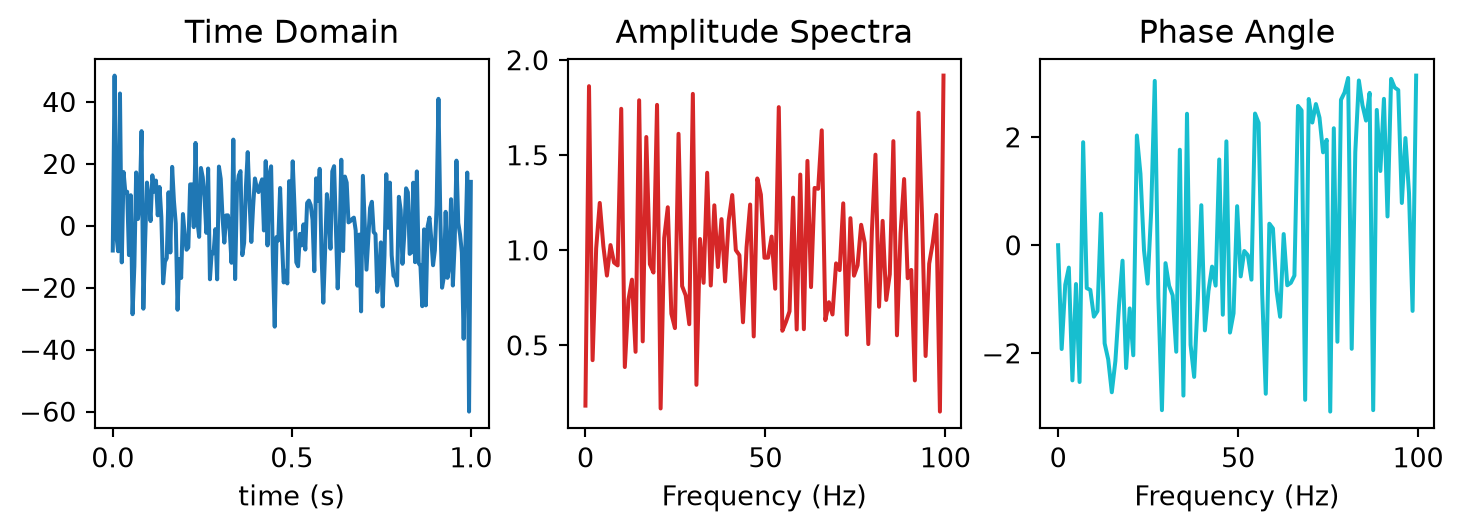
white_smooth_band = noisy_patch.whiten(smooth_size=2, time=(10, 20, 80, 90))
plot_time_and_frequency(white_smooth_band);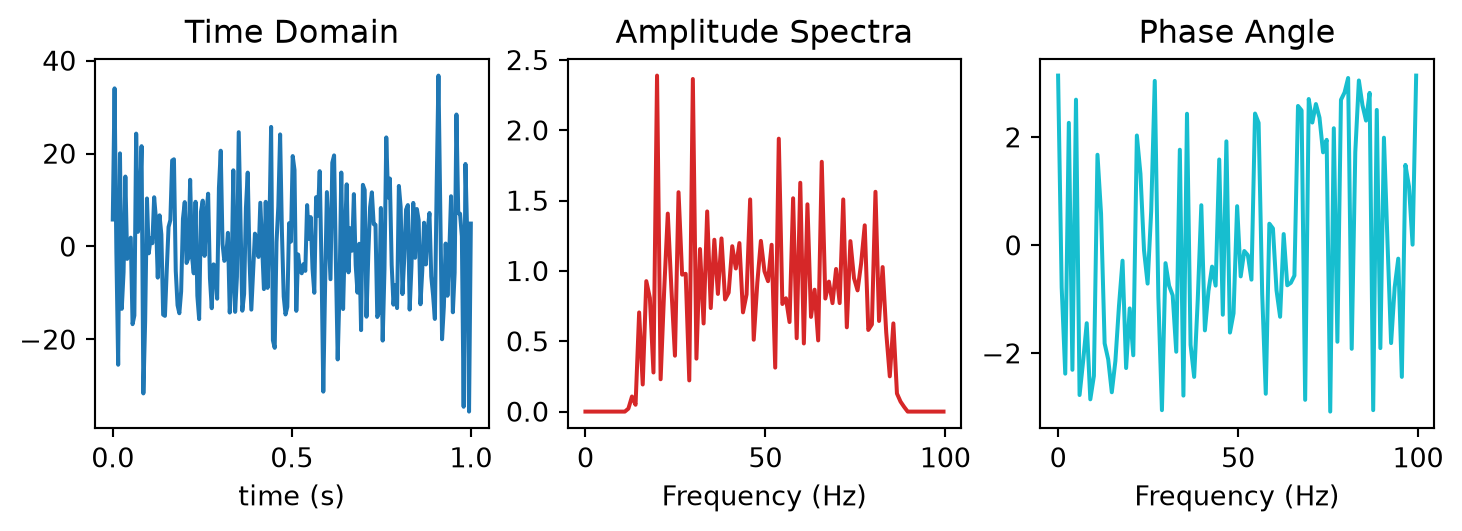
Frequency-domain input
whiten also accepts a patch in the frequency domain and then returns one, which suits workflows that are already in the frequency domain.
fft_patch = noisy_patch.dft("time", real=True)
dft_white = fft_patch.whiten(smooth_size=1, time=(20, 40, 60, 80))
td_patch = dft_white.idft()
plot_time_and_frequency(td_patch);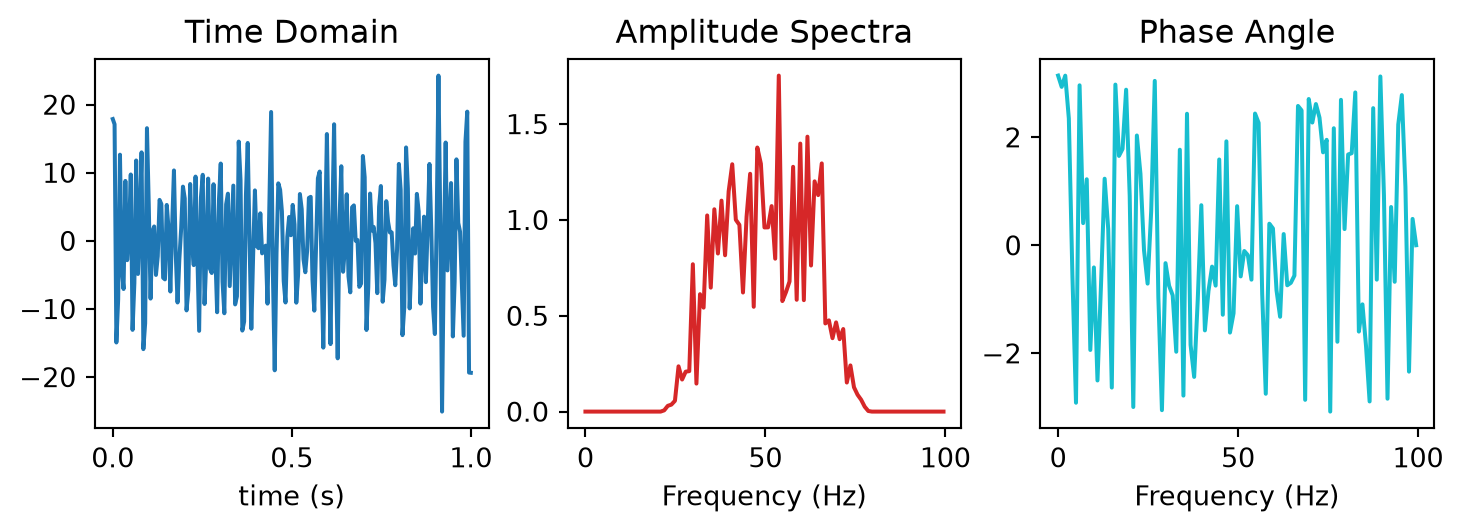
The water_level parameter stabilizes frequencies whose amplitudes are near zero.