Window lengths use coordinate units or samples (samples=True). overlap accepts a count, duration, percentage, or per-dimension mapping.
Tiles, blended
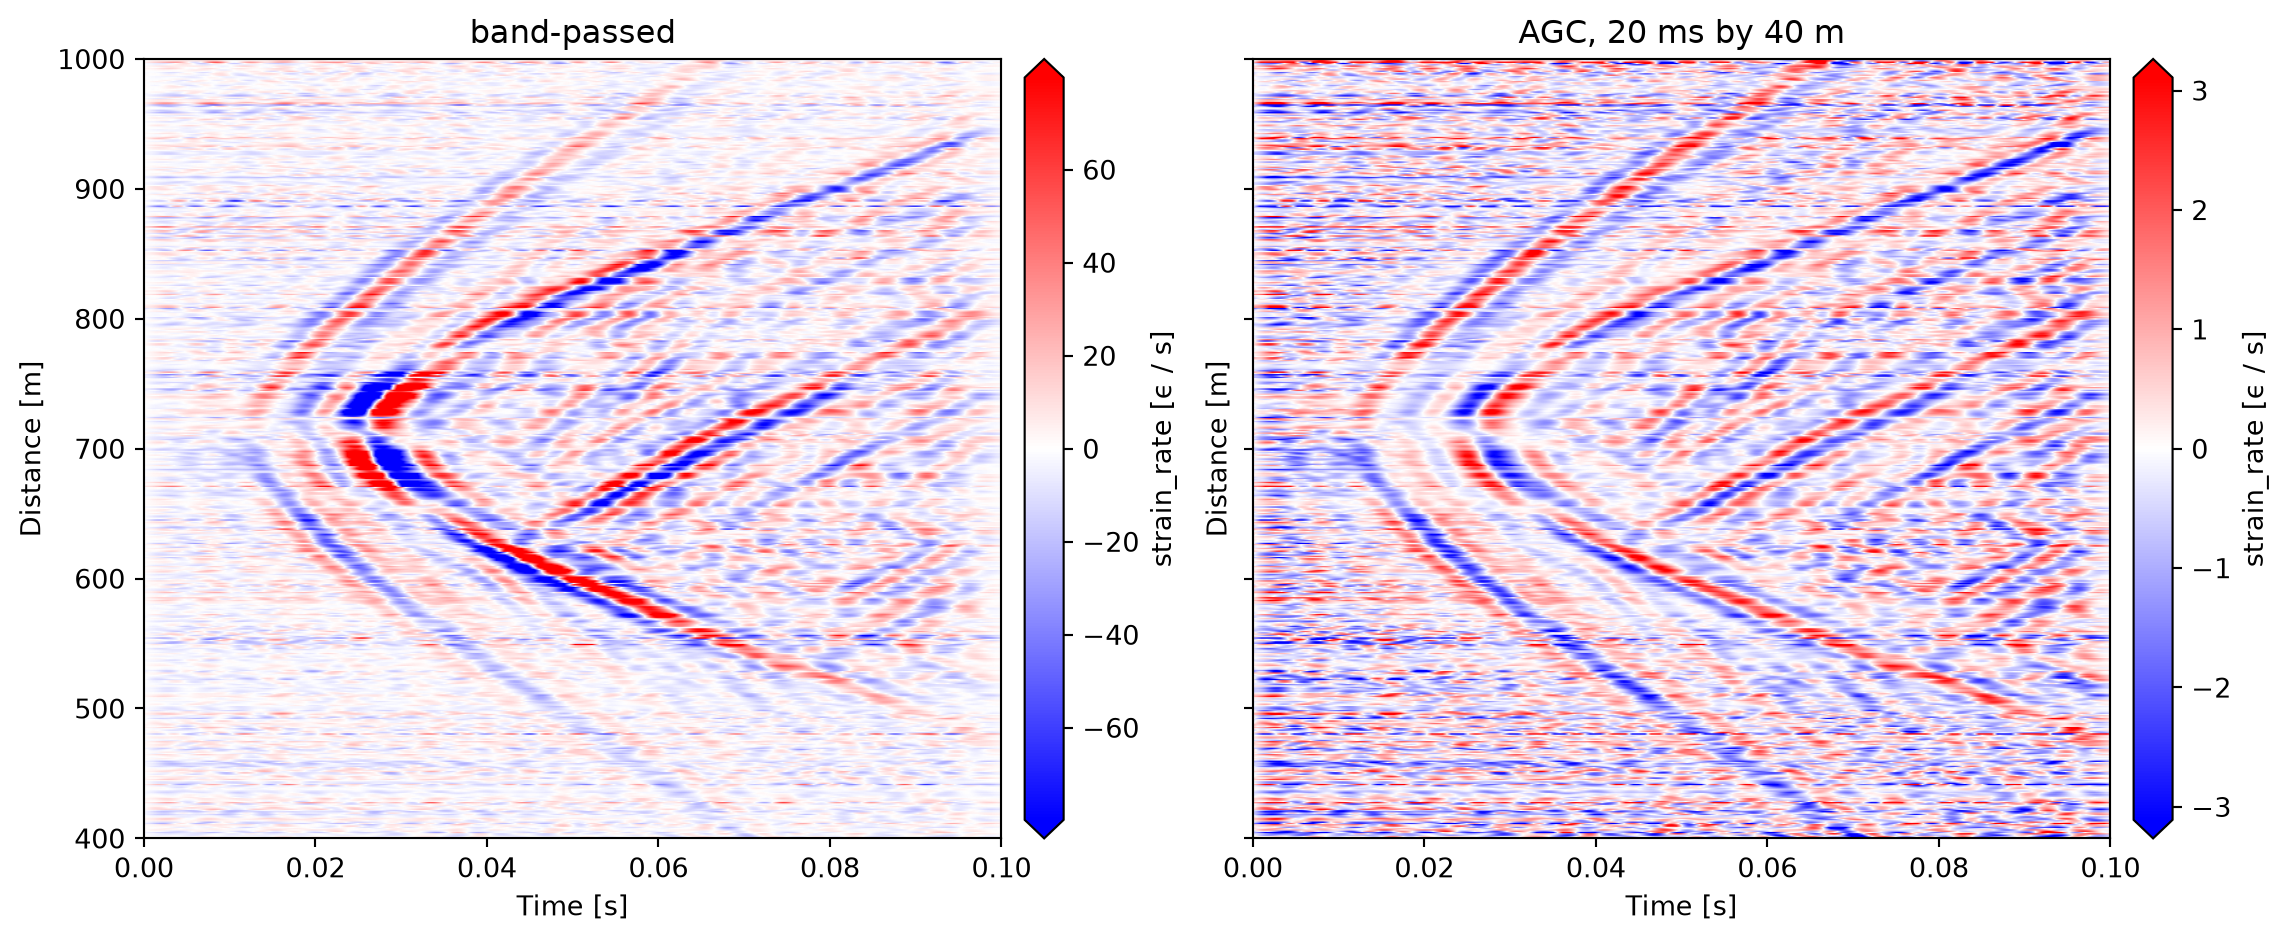
tile_apply passes an [n_tiles, *window] array to a function and blends its same-shaped result with complementary tapers. An identity function reconstructs the input exactly. This example applies windowed automatic gain control:
import numpy as npimport matplotlib.pyplot as pltimport dascore as dcfrom dascore.units import percentpatch = dc.get_example_patch("example_event_2").pass_filter(time=(1, 300))def agc(tiles):"""Scale every tile to unit RMS.""" rms = np.sqrt(np.mean(tiles**2, axis=(1, 2), keepdims=True))return tiles / np.where(rms >0, rms, 1)normalized = patch.tile_apply(agc, time=0.02, distance=40)fig, axes = plt.subplots(1, 2, figsize=(12, 5), sharey=True)for ax, pa, title inzip(axes, [patch, normalized], ["band-passed", "AGC, 20 ms by 40 m"]): scale = np.percentile(np.abs(pa.data), 99) pa.viz.waterfall(ax=ax, scale=scale, scale_type="absolute", cmap="bwr") ax.set_title(title)fig.tight_layout()
With mode="stack", tiles remain separate. Windowed dimensions become tile-center axes, {dim}_start and {dim}_stop record physical cell edges in the dimension’s units, and tile samples use {dim}_offset. Process the stack as a patch, then reassemble it. Paired physical bounds require monotonic row order; explicitly drop the public bounds before an arbitrary tile permutation. Private reconstruction indices follow the rows and still allow reassembly.
tiles = patch.tile_apply(lambda x: x, mode="stack", time=0.02, distance=40)print(tiles.dims, tiles.shape)# Drop every tile whose energy is in the lowest quarter, then blend back.# The mean keeps the offset axes at length one, so a per-tile flag# broadcasts back over every sample of its tile.energy = (tiles**2).mean(dim=("distance_offset", "time_offset"))quiet = energy.data < np.percentile(energy.data, 25)kept = tiles.new(data=np.where(quiet, 0, tiles.data))denoised = kept.reassemble()assert denoised.shape == patch.shape
An unchanged stack reassembles exactly. stft transforms the offset axes; istft inverts them and reassembles.
A compiled function, one tile at a time
A Numba-compiled function receives one tile at a time in parallel. This supports any number of dimensions and mode="stack", with a one-time compilation cost per process.
By default only blending is tapered. Set analysis to window each tile before the function; blending uses the window’s dual so identity remains exact and overlap may exceed half the window.
def keep_strongest(tiles):"""Keep the largest quarter of each tile's f-k coefficients.""" spectra = np.fft.rfft2(tiles) cutoff = np.percentile(np.abs(spectra), 75, axis=(1, 2), keepdims=True)return np.fft.irfft2(np.where(np.abs(spectra) < cutoff, 0, spectra), s=tiles.shape[1:])local_fk = patch.tile_apply(keep_strongest, analysis="hann", overlap=75* percent, time=0.02, distance=40)assert local_fk.shape == patch.shape
What a tile sees
Tiles extend before the data with zero padding so every contributing tile exists. Overlap defaults to half the window and cannot exceed half with blend-only tapers; analysis windows may overlap as far as SciPy can invert them. get_window supplies supported taper shapes.