An AnnotationSet records where things are in a patch’s dimensions: phase picks, boxes around noise, vehicle tracks, outlines of a region. It is a dataframe first. A picker’s output is one table, and the same set can grow into grouped events, paths and polygons without changing what it already holds.
Annotations describe data but never hold it. They are stated in coordinates, not sample indices, so they stay valid when the data is decimated, trimmed or re-chunked.
The model
A set has three parts:
annotations: one row per located thing. For each dimension a row states a single value (time), a half-open range (time_min, time_max), or nothing, in which case it spans that dimension. A row stating only time is an instant across the whole fiber.
features: what rows compose. Every row belongs to one feature, named by its feature_id; a row with none is its own feature. A feature is a group (unordered, the default), a path (vertices ordered by seq), or a polygon (rings ordered by seq, ring 0 outside, holes after). part numbers the pieces of a multipart shape.
bases: named curves, such as a line or a moveout, that a path is drawn from. A path may state only its basis and is sampled when needed.
Any other column, such as phase, confidence or note, is yours and is kept as written. Features hold no coordinates; their bounds come from their rows.
time
distance_min
distance_max
phase
feature_id
reads as
0.01
P
an instant across the fiber
0.01
650
750
P
event_1
a pick on a stretch, part of event_1
400
450
a stretch of fiber at all times
Picks
A picker’s output is a single table. AnnotationSet.from_patch takes the dimensions from the patch and stamps its acquisition_key and data_id, so the set records which data it was made on.
A set of only annotations writes as one bare file. The file holds the annotations table, with no features or bases. A CSV records neither the dimensions nor the set’s attributes, such as data_id; reading states the dimensions again, and may state the attributes. io.to_parquet writes a Parquet file that keeps both, and needs pyarrow. The directory form described under Saving and loading keeps them in either encoding.
Three interval rules meet here: a row’s _min/_max range is half-open, a select tuple includes both ends, and overlapping given a patch includes the patch’s last sample.
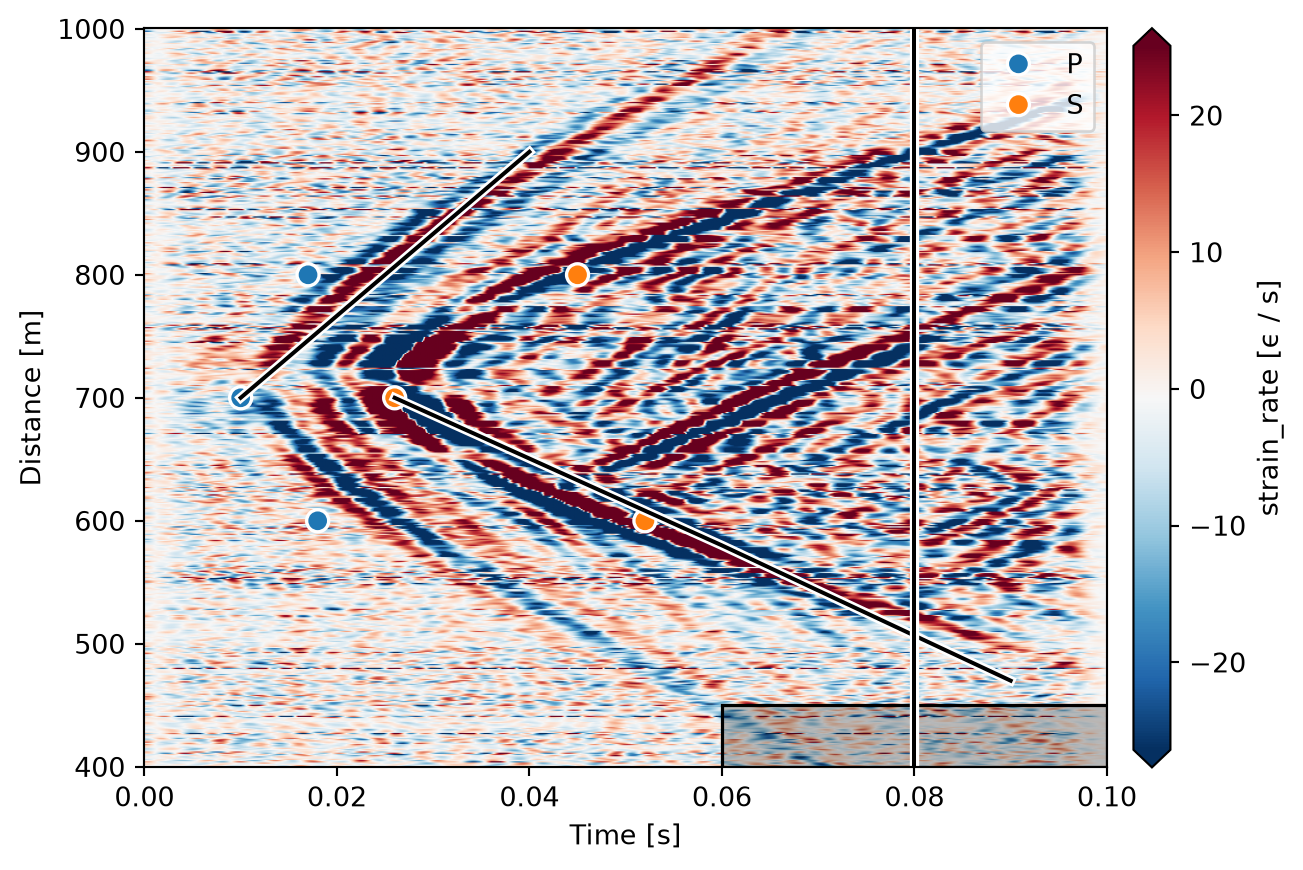
bounds gives each feature’s extent, one row per feature:
ann.bounds()
feature_id
annotation
kind
distance_min
distance_max
time_min
time_max
0
event_1
<NA>
group
600.0
800.0
0.010
0.052
1
s_wave
<NA>
path
470.0
700.0
0.026
0.090
2
p_wave
<NA>
path
700.0
900.0
0.010
0.040
3
noise
<NA>
polygon
400.0
450.0
0.060
0.100
Cutting data
Spool.cut returns one lazy patch per feature, cut to its bounds and merged across the files it crosses. A range is cut to its ends, both included. A pad, (before, after) offsets along a dimension, extends the ends that are stated values, and a feature at a single value needs one. A dimension the feature spans is kept whole. Each patch states feature_id (blank for a lone row) and annotation (a lone row’s label, blank for a feature), so the contents join back to the set:
ann.viz.plot draws every feature on an axis, putting dimensions where waterfall puts them. Draw the patch first and the annotations over it. color may name a column, giving one color per value and a legend; features with no value, here the paths, the polygon and a trigger time added across the fiber, are black, so they read over the waterfall: lines and markers with a white halo, filled shapes with a solid edge. palette fixes the colors of chosen values, e.g. palette={"P": "tab:red", "S": "tab:cyan"}, and when no color column is given and two or more kinds are drawn, a legend names the kinds:
A pick is a marker, a path a line, a polygon a filled shape, and a row spanning one axis a line or band across it.
Editing
update changes the columns of one feature or one annotation, and remove drops one. merge combines sets stated in the same dimensions, such as hand and automatic picks.
ann = ann.update(feature="event_1", magnitude=1.2).remove(feature="noise")
Saving and loading
A set with features or bases is saved as a directory holding attrs.json, the annotations and features tables, and bases.json. dc.annotations reads it back, and also reads bare tables and collections of sets:
directory = ann.io.save(folder /"event_1")assert dc.annotations(directory) == ann