# Plot the default patch
import dascore as dc
patch = dc.get_example_patch()
_ = patch.viz.wiggle()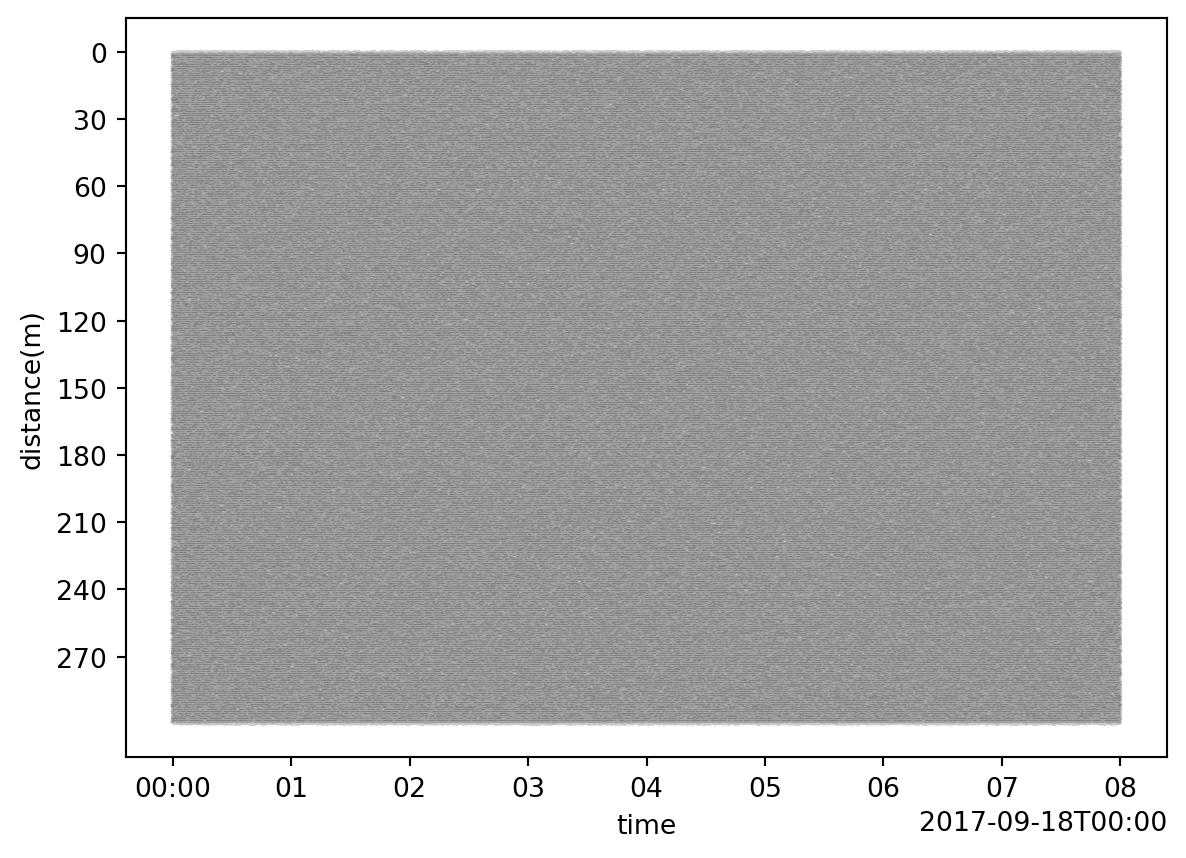
wiggle(
patch: Patch ,
dim: str = time,
scale: float = 1,
alpha: float = 0.2,
color: str = black,
shade: bool = False,
ax: matplotlib.axes._axes.Axes | None[Axes, None] = None,
show: bool = False,
)-> ‘plt.Figure’
Create a wiggle plot of patch data.
| Parameter | Description |
|---|---|
| patch | The Patch object. |
| dim | The dimension along which samples are connected. |
| scale |
The scale (or gain) of the waveforms. A value of 1 indicates waveform centroids are separated by the average total waveform excursion. |
| alpha | Opacity of the wiggle lines. |
| color | Color of wiggles |
| shade |
If True, shade all values of each trace which are less than the mean trace value. |
| ax | A matplotlib object, if None ne will be created. |
| show | If True, show the plot, else just return axis. |
# Plot the default patch
import dascore as dc
patch = dc.get_example_patch()
_ = patch.viz.wiggle()