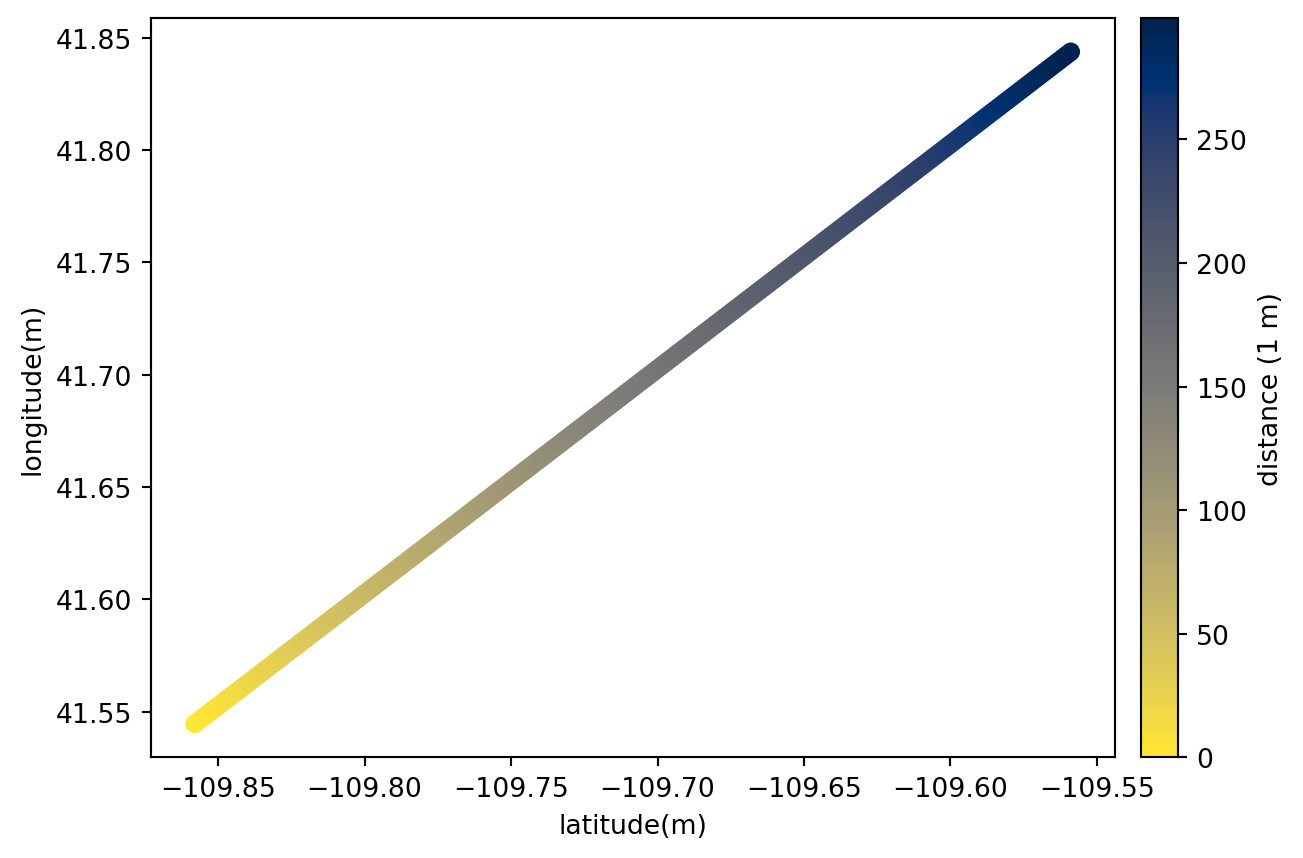
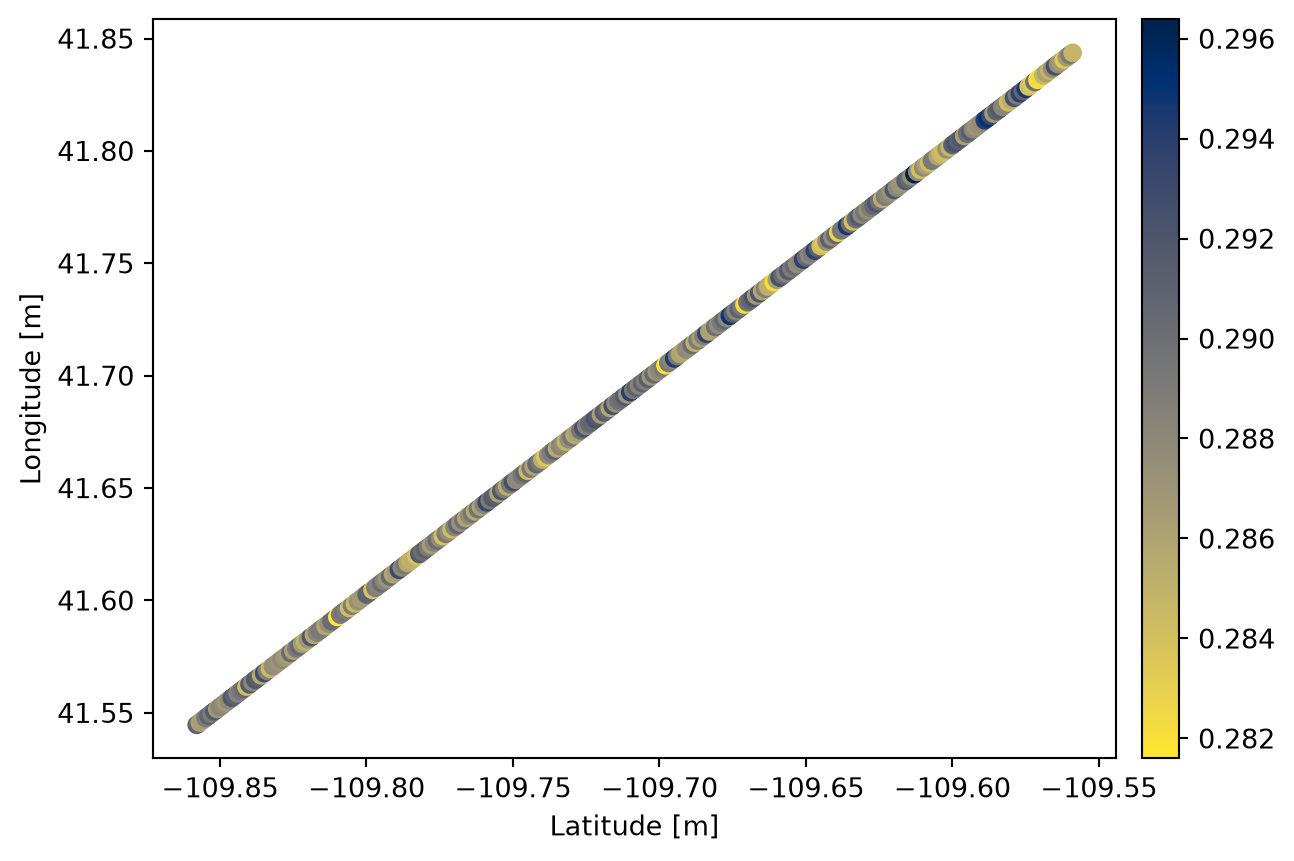
The color parameter to plot: can be an array, the name of a patch coordinate, or “data” to color by the patch’s own data, which needs one value for each point drawn. A coordinate of that name wins.
ax
A matplotlib object, if None create one.
cmap
A matplotlib colormap string or instance. Set to None to not plot the colorbar.
scale
If not None, controls the saturation level of the colorbar. A single number is symmetric: with scale_type="relative" the limits sit that fraction of half the data range either side of the mean, and with scale_type="absolute" they are -abs(scale) and abs(scale). A pair of numbers gives the lower and upper limits: fractions of the data range, from 0 to 1, when relative, or the values themselves when absolute. Percent quantities, such as 10 * dc.units.percent, are converted to fractions.
scale_type
Interpret scale as relative fractions or absolute values.
show
Whether to show the plot.
Examples
# Plot patchimport dascore as dcpatch = dc.get_example_patch("random_patch_with_lat_lon")patch = patch.set_units(latitude="m", longitude="m")_ = patch.viz.map_fiber("latitude", "longitude", "distance")# Color by the data itself, reduced to one value per channel.reduced = patch.std("time").squeeze()_ = reduced.viz.map_fiber("latitude", "longitude", "data")