# Plot the default patch
import dascore as dc
patch = dc.get_example_patch()
_ = patch.viz.wiggle()

# A single trace plots as one line
trace = patch.select(distance=0, samples=True)
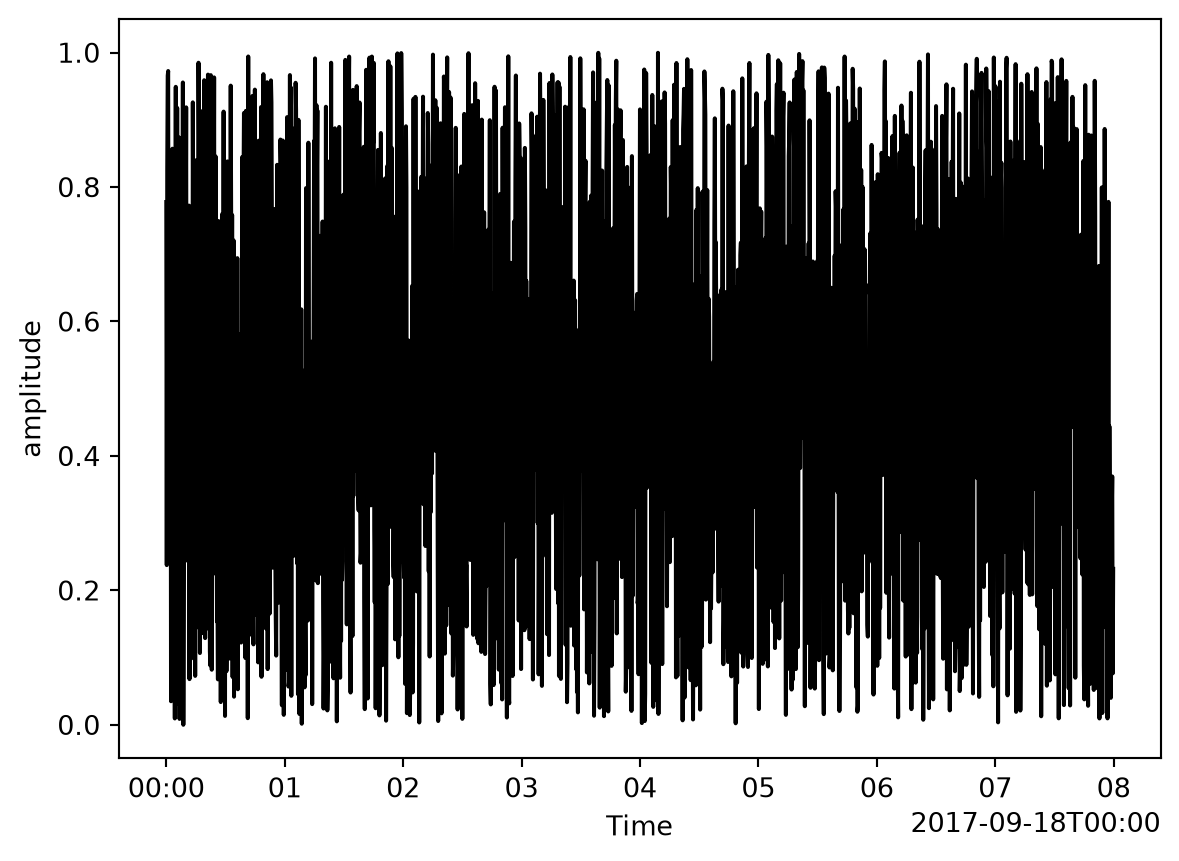
_ = trace.viz.wiggle()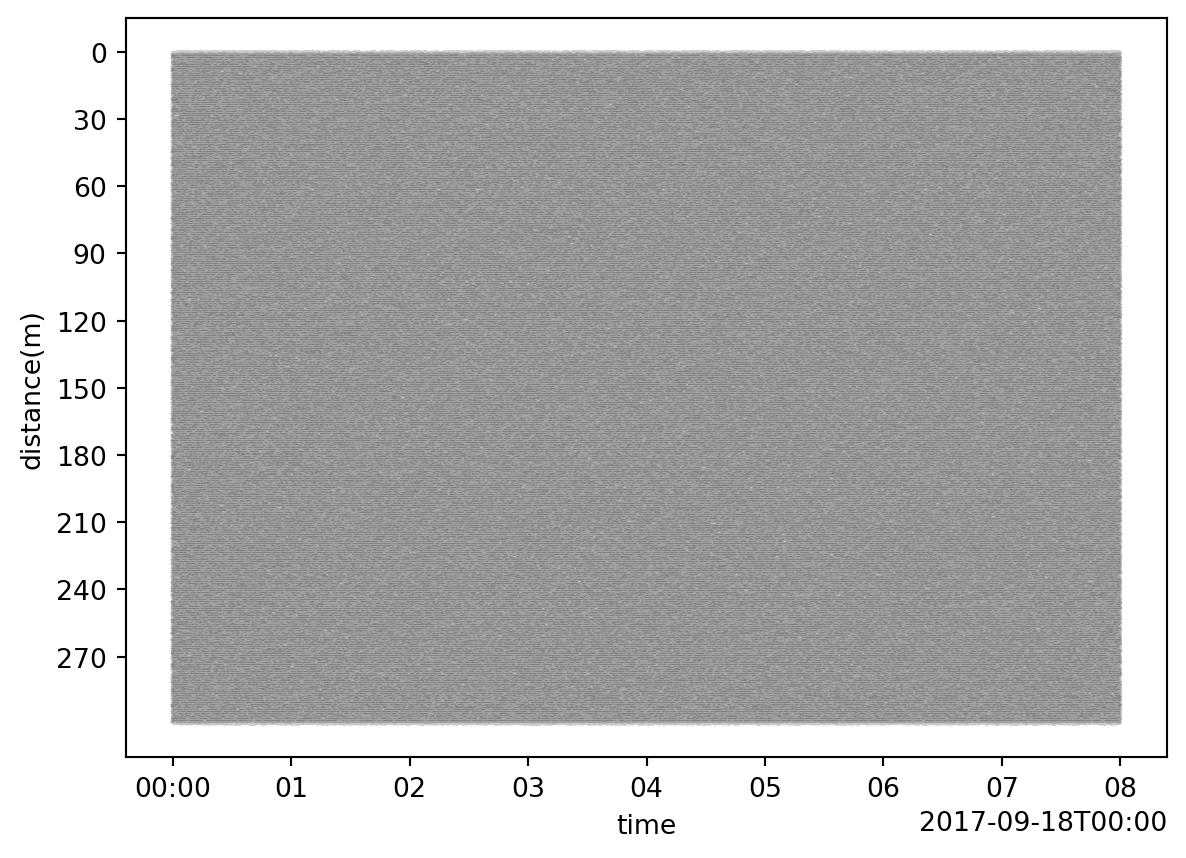
wiggle(
patch: Patch ,
dim: str = time,
scale: float = 1,
alpha: float | None[float, None] = None,
color: str = black,
shade: bool = False,
ax: matplotlib.axes._axes.Axes | None[Axes, None] = None,
show: bool = False,
)-> ‘plt.Figure’
Create a wiggle plot of patch data.
Length one dimensions are squeezed out first. A patch left with a single dimension (e.g., an OTDR trace stored as (time: 1, distance: N)) is drawn as one line against that dimension, with the data type and units (or “amplitude” if the patch has neither) on the y axis. A patch left with two dimensions is drawn as one wiggle per trace.
| Parameter | Description |
|---|---|
| patch | The Patch object. |
| dim |
The dimension along which samples are connected. Ignored if only one dimension remains after squeezing. |
| scale |
The scale (or gain) of the waveforms. A value of 1 indicates waveform centroids are separated by the average total waveform excursion. |
| alpha |
Opacity of the wiggle lines. Defaults to 0.2 for 2D patches, where neighboring wiggles overlap, and 1.0 for a single trace. |
| color | Color of wiggles |
| shade |
If True, shade all values of each trace which are greater than the trace offset (zero for a single trace). |
| ax | A matplotlib object, if None ne will be created. |
| show | If True, show the plot, else just return axis. |
# Plot the default patch
import dascore as dc
patch = dc.get_example_patch()
_ = patch.viz.wiggle()
# A single trace plots as one line
trace = patch.select(distance=0, samples=True)
_ = trace.viz.wiggle()
Traces are drawn as offsets along the y axis, so which way that axis runs also decides which way positive amplitudes point.
As in waterfall, the y axis is inverted only when it is “time-like”. Traces stacked along distance (the default) therefore leave it alone, and positive amplitudes point up just as they point right in a conventional (time down) wiggle display. Traces stacked along time (dim="distance") invert it to keep time increasing downward, and the amplitudes follow it down. To undo either, invert the y axis of the returned axis object.