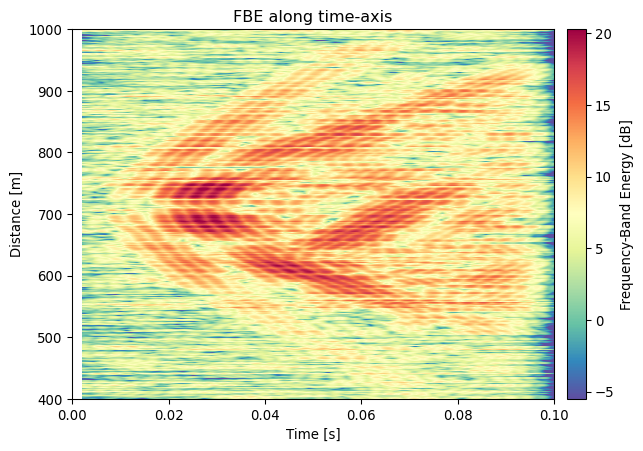
Compute the rolling Frequency Band Energy in a window. This is the Root-Mean-Squared (RMS) of the Energy in a Frequency Band (the FBE), and commonly called ‘the waterfall plot’ in DAS-processing. This implementation is a wrapper to DAScore functionality: 1) Apply a ‘pass_filter’ to the patch 2) Apply rolling-funtction of a window along a coordinate 3) Calculate RMS value
Parameters
Parameter
Description
patch
Input DASCore patch.
window
window length in which to caluclate engergy (in units of the sampling rate)
step
time-step for rolling window. Defaults to original sampling rate, but this can be used for downsampling of the resulting patch. See also rolling
db
Return patch data in decibel [dB] instead of orginal units. Decibel is calculated as 20 * log10( sqrt(mean(x^2))) ).
**kwargs
Used to specify the dimension and asociated frequency, wavelength, or equivalent limits. For example time=(1, 100) applies a time-dimension bandpass of 1-100 Hz. See pass_filter for more details.
Returns
PatchType A new patch containing FBE-RMS traces.
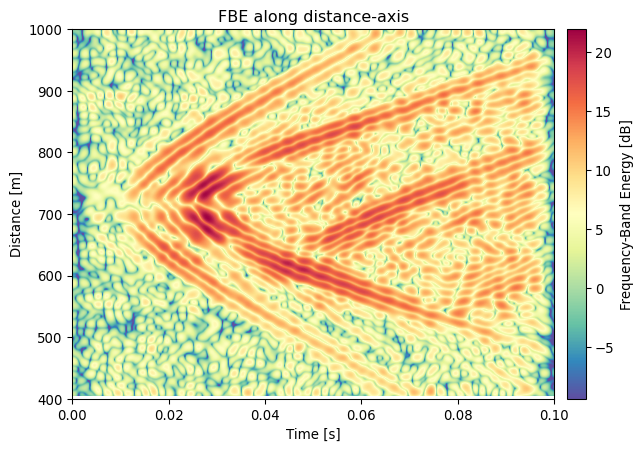
Example
import dascore as dcp = dc.examples.example_event_2()fbe_patch = p.fbe(time=(100,200), window =0.002)ax = fbe_patch.viz.waterfall(cmap ='Spectral_r')_ = ax.set_title('FBE along time-axis')import dascore as dcp = dc.examples.get_example_patch('example_event_2')fbe_patch = p.fbe(distance=(.01,.05), window =5)ax = fbe_patch.viz.waterfall(cmap ='Spectral_r')_ = ax.set_title('FBE along distance-axis')